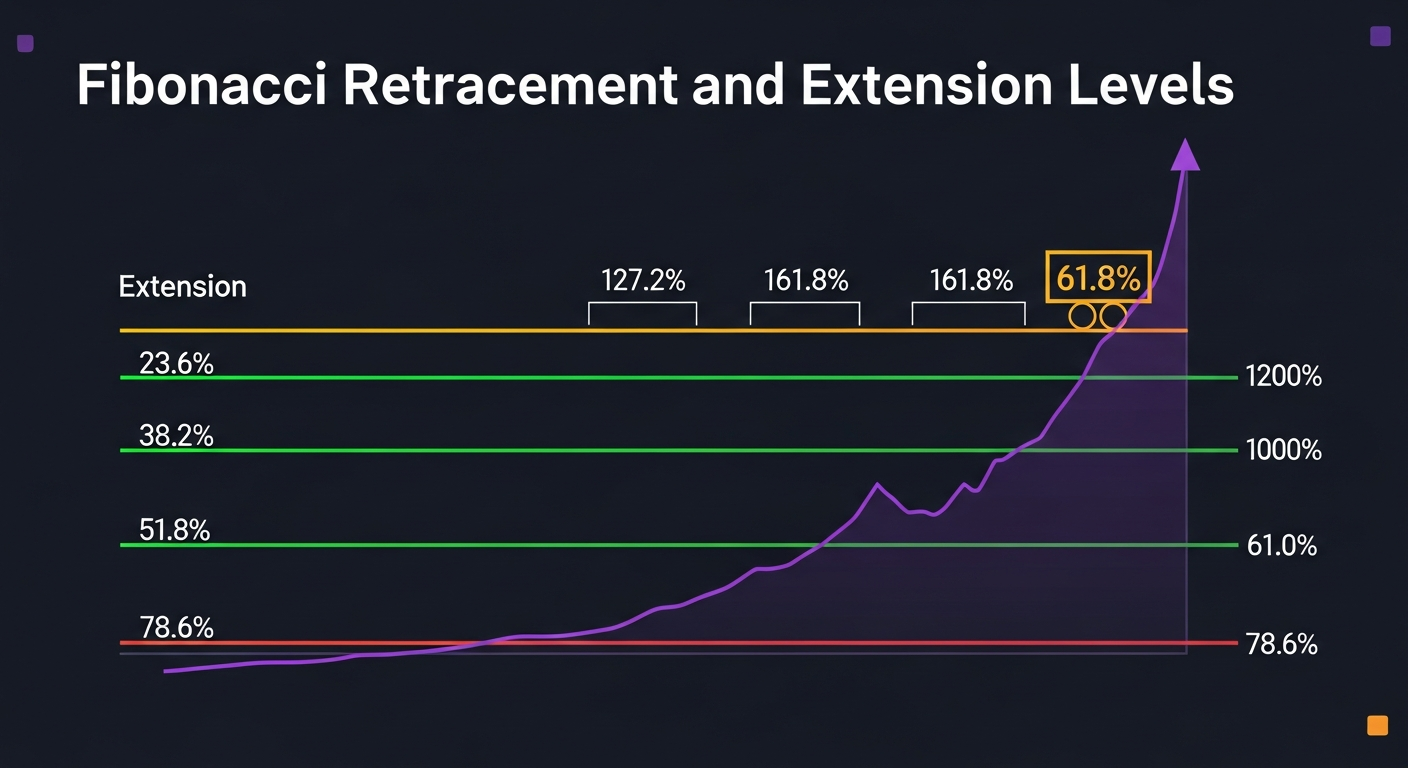
Fibonacci Levels Infographic
All key retracement and extension levels in one visual guide. Free to download and share.
Share this infographic:
Embed This Infographic
Want to share this on your website or blog? Copy the embed code below:
<a href="https://easycharts.trading/infographics/fibonacci-levels" target="_blank" rel="noopener">
  <img src="https://easycharts.trading/infographics/fibonacci-levels.png" alt="Fibonacci Levels Infographic by EasyCharts" style="max-width:100%;height:auto;" />
</a>
<p>Infographic by <a href="https://easycharts.trading">EasyCharts</a></p>
Complete Fibonacci Level Reference
Shallow pullback - strong trend, aggressive entry
Common pullback level in healthy trends
Psychological midpoint (not a true Fib number)
The Golden Ratio - most important level
Deep retracement - last chance for trend continuation
First profit target after breakout
Golden extension - primary target
Extended target in strong momentum
Frequently Asked Questions
What is the Golden Ratio in trading?
The Golden Ratio (61.8%) is derived from the Fibonacci sequence and is considered the most important retracement level. In trading, prices often find support or resistance at this level during pullbacks, making it a popular entry point for trend-following traders.
How do I draw Fibonacci levels on a chart?
In an uptrend, draw from the swing low to the swing high. In a downtrend, draw from the swing high to the swing low. Most charting platforms have a Fibonacci retracement tool that automatically calculates all the levels for you.
Which Fibonacci level is most reliable?
The 61.8% (Golden Ratio) and 38.2% levels are considered most reliable for retracements. For extensions, 161.8% is the primary target. However, it's best to use Fibonacci levels in confluence with other indicators like support/resistance zones and volume.