
What is Elliott Wave Theory?
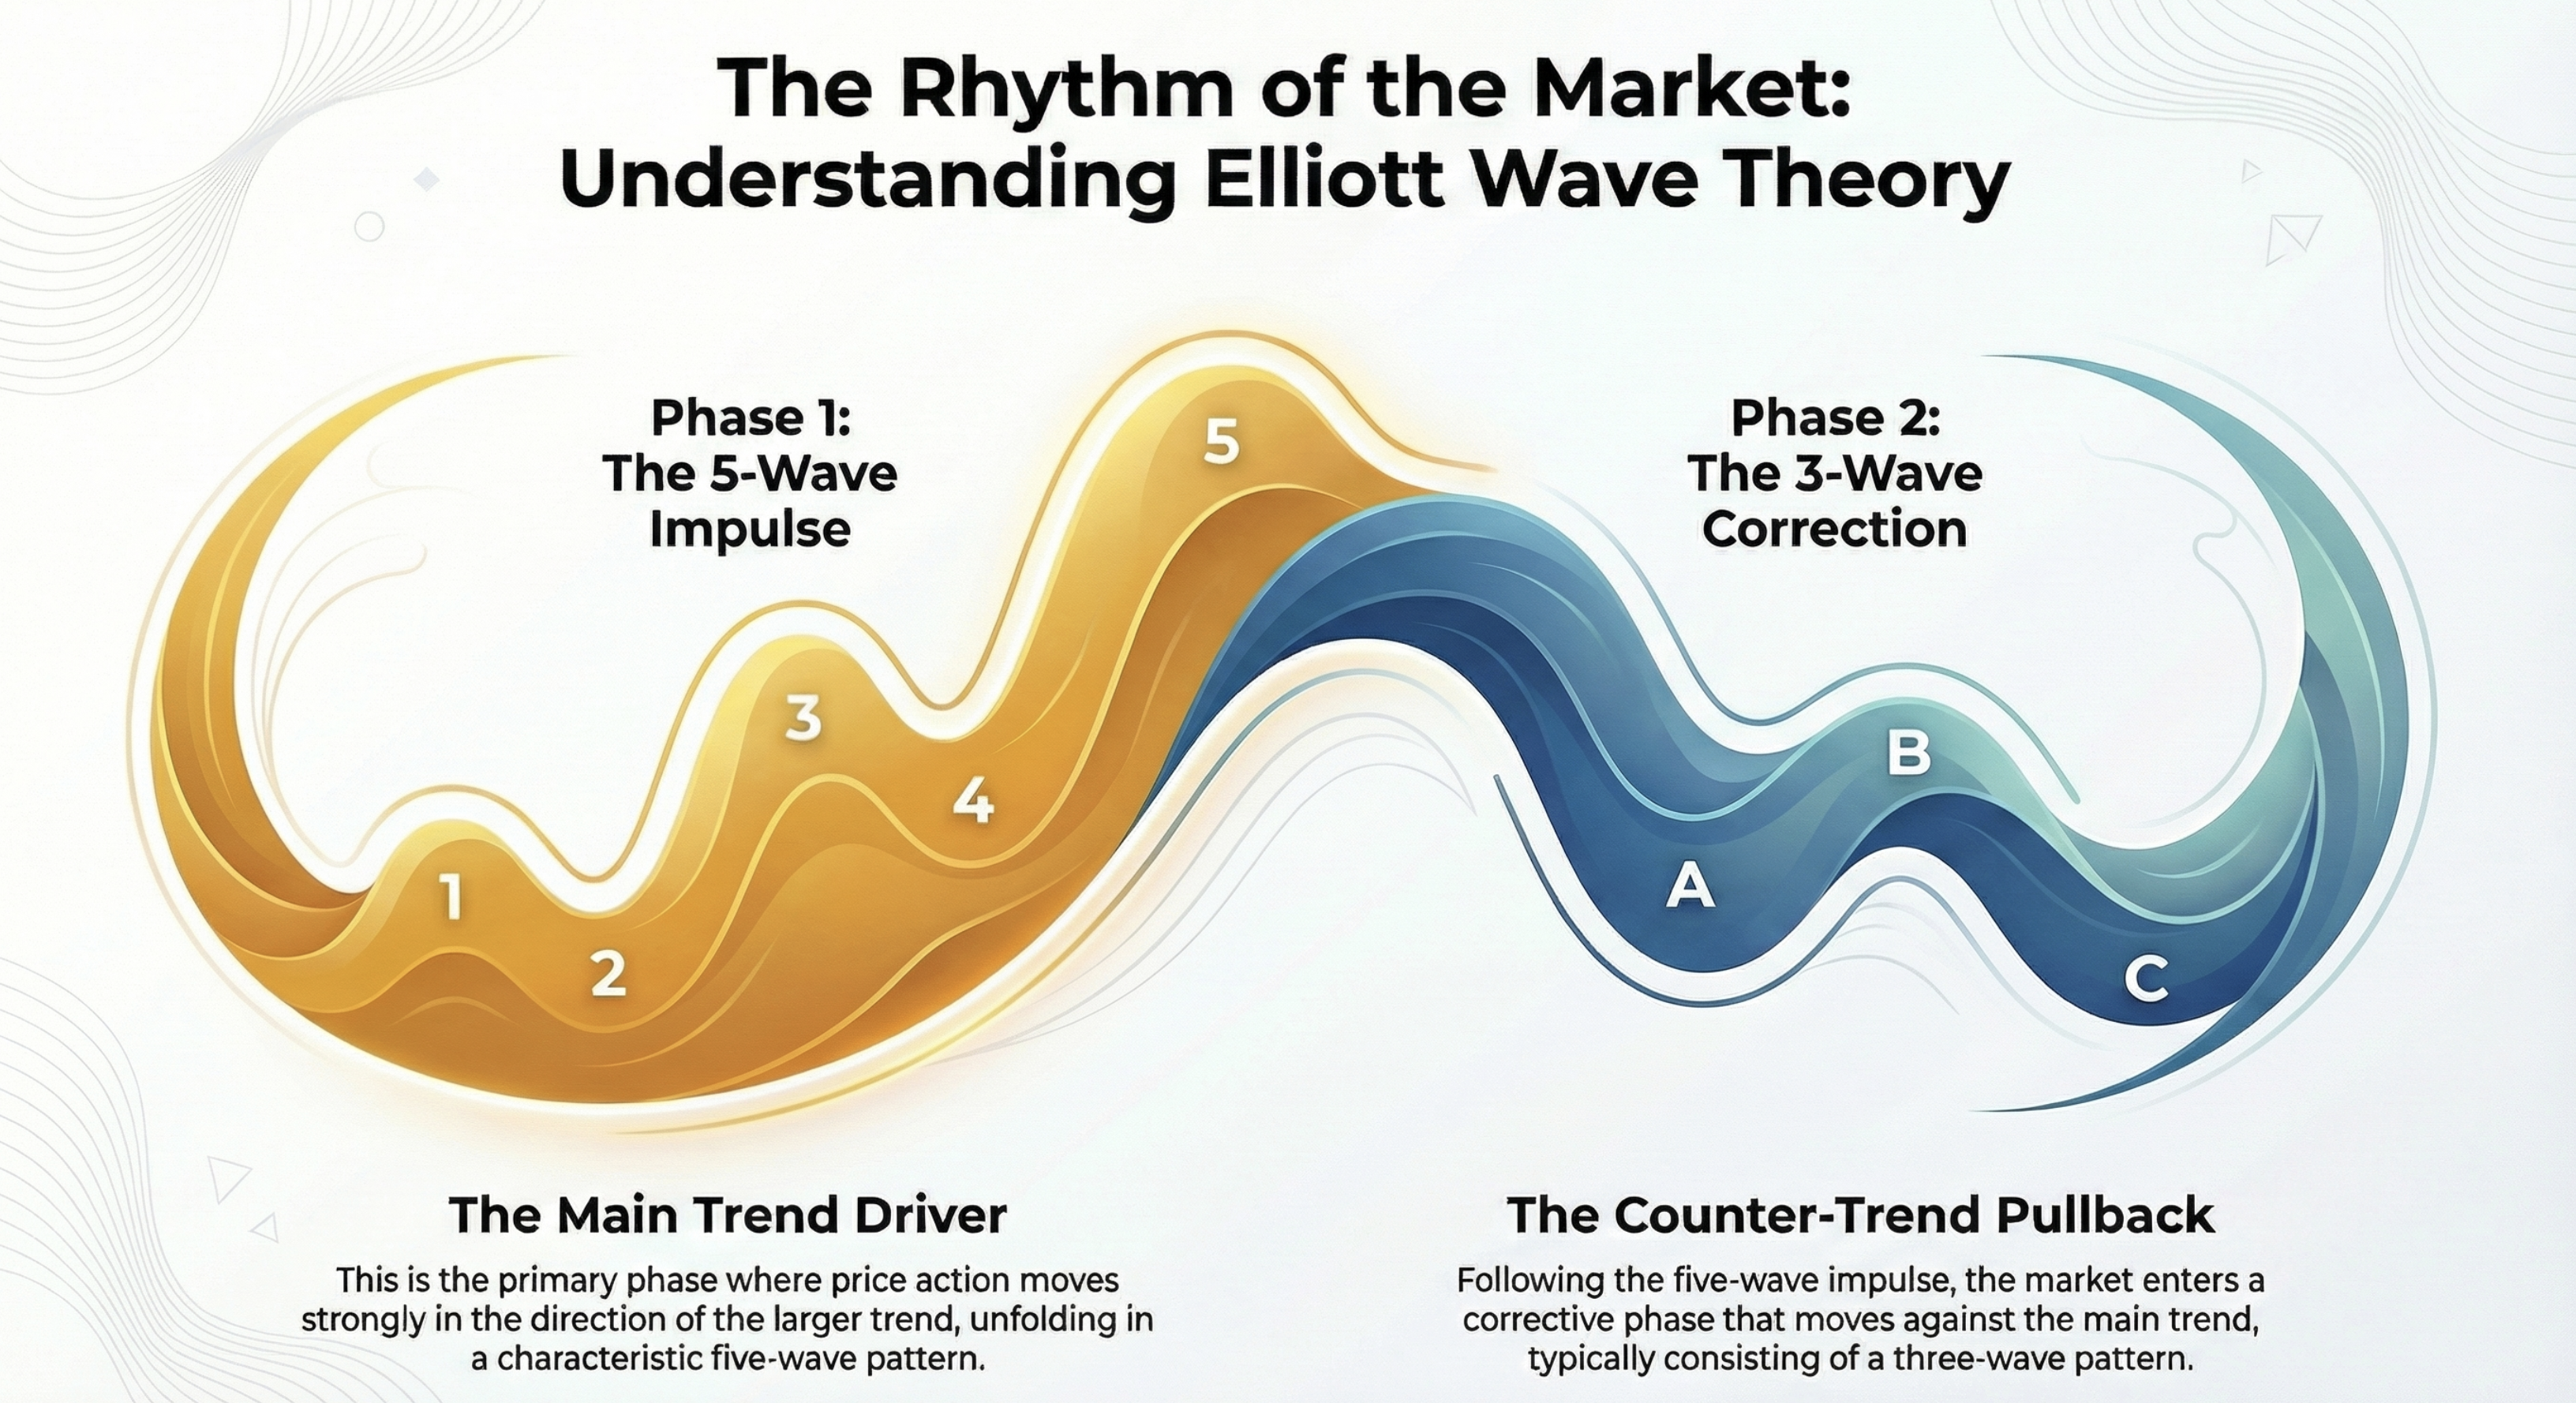
Elliott Wave Theory was developed by Ralph Nelson Elliott in the 1930s. He discovered that market prices don't move randomly - they follow recognizable patterns driven by investor psychology.
The core idea is simple: markets move in waves. Trending moves happen in 5 waves, and corrections happen in 3 waves. This pattern repeats at every timeframe, from 1-minute charts to monthly charts.
Impulse Waves (1-2-3-4-5)
These move in the direction of the main trend. Waves 1, 3, and 5 move with the trend (motive waves), while waves 2 and 4 move against it (corrective waves within the impulse).
Corrective Waves (A-B-C)
These move against the main trend. After a 5-wave impulse completes, a 3-wave correction typically follows before the next impulse begins.
The 3 Unbreakable Rules
To validate a wave count, it must adhere to these three strict, unbreakable rules for technical market analysis.
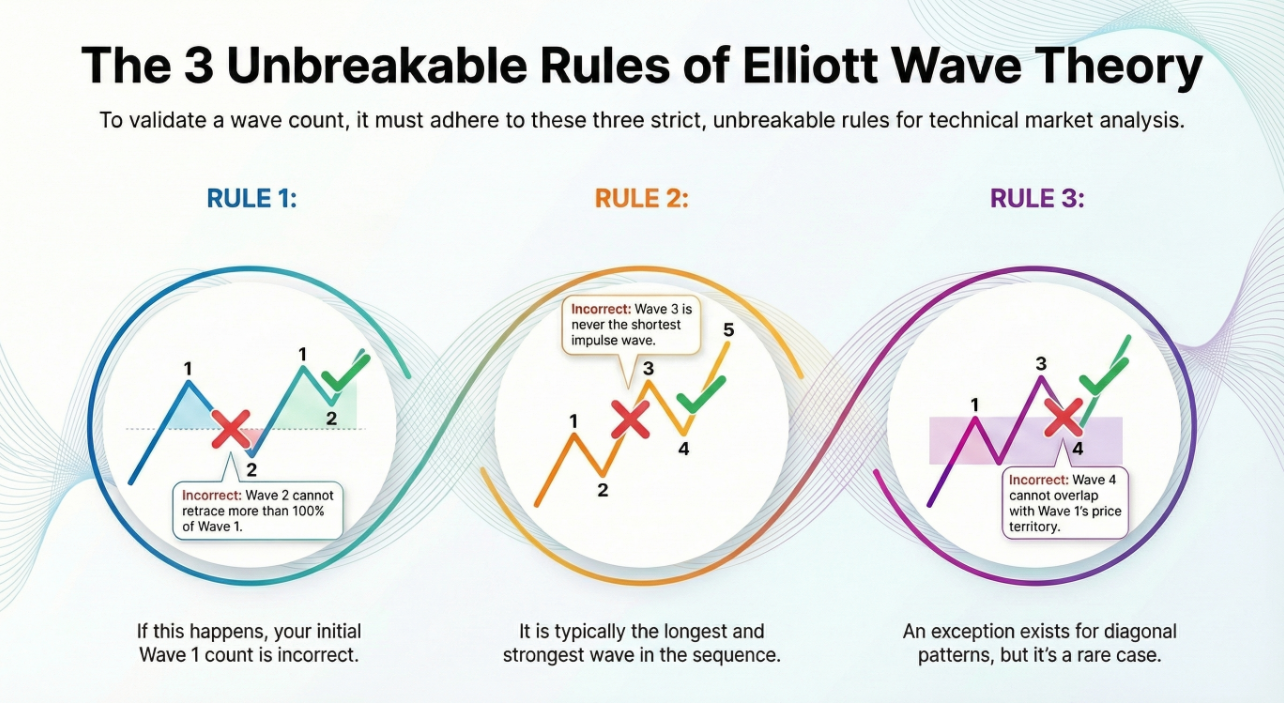
Wave 2 cannot retrace more than 100% of Wave 1
If it does, your Wave 1 count is wrong
Wave 3 is never the shortest impulse wave
Wave 3 is usually the longest and strongest
Wave 4 cannot overlap Wave 1's price territory
Exception: diagonal patterns in Wave 5
If any of these rules are broken, your wave count is incorrect and needs to be revised.
Helpful Guidelines
Unlike rules, guidelines don't invalidate a wave count - but they help identify the most probable scenarios.
How to Start Counting Waves
Start with the Bigger Picture
Always begin by looking at higher timeframes (weekly, daily) to understand the major trend before zooming into smaller timeframes.
Look for Clear 5-Wave Patterns
Find obvious impulse moves where you can clearly identify 5 waves. Don't force counts on choppy price action.
Use Fibonacci for Confirmation
Verify your wave counts with Fibonacci ratios. If Wave 2 retraces exactly 61.8% and Wave 3 extends to 161.8%, you're likely on the right track.
Keep Multiple Scenarios
Have an "alternate count" ready. Markets can unfold in different ways, and the best analysts always have backup interpretations.
How These Wave Counts Are Built
Quick Intro to WaveBasis
We use WaveBasis, a professional Elliott Wave platform, to generate and stress-test wave counts before verifying every one by hand.
- Automatic Elliott Wave counts
- Smart pattern-recognition tools
- Real-time wave scanner
Affiliate link: we may earn a commission if you subscribe, at no extra cost to you.
Theory → Real Application
See how professionals apply Elliott Wave counts to Bitcoin & MSTR with Gann Fan geometry and Fibonacci analysis.
This PDF Shows You:
- Professional wave labeling on weekly charts
- How Fibonacci levels confirm wave counts
- Gann Fan time & price geometry
- Real target projections with risk levels
- MSTR as a leveraged Bitcoin play
Bitcoin & MSTR Thesis
Professional Analysis - Free Download
No email required - instant access
Ready to Practice?
Apply what you've learned with paper trading. Test your strategies without risking real money.
TradingView Setup
Free platform guide with 3 essential indicators
30 Min/Day Practice
Build real skills with structured daily practice
Risk-Free Learning
Test strategies before committing real capital