
Quick Summary
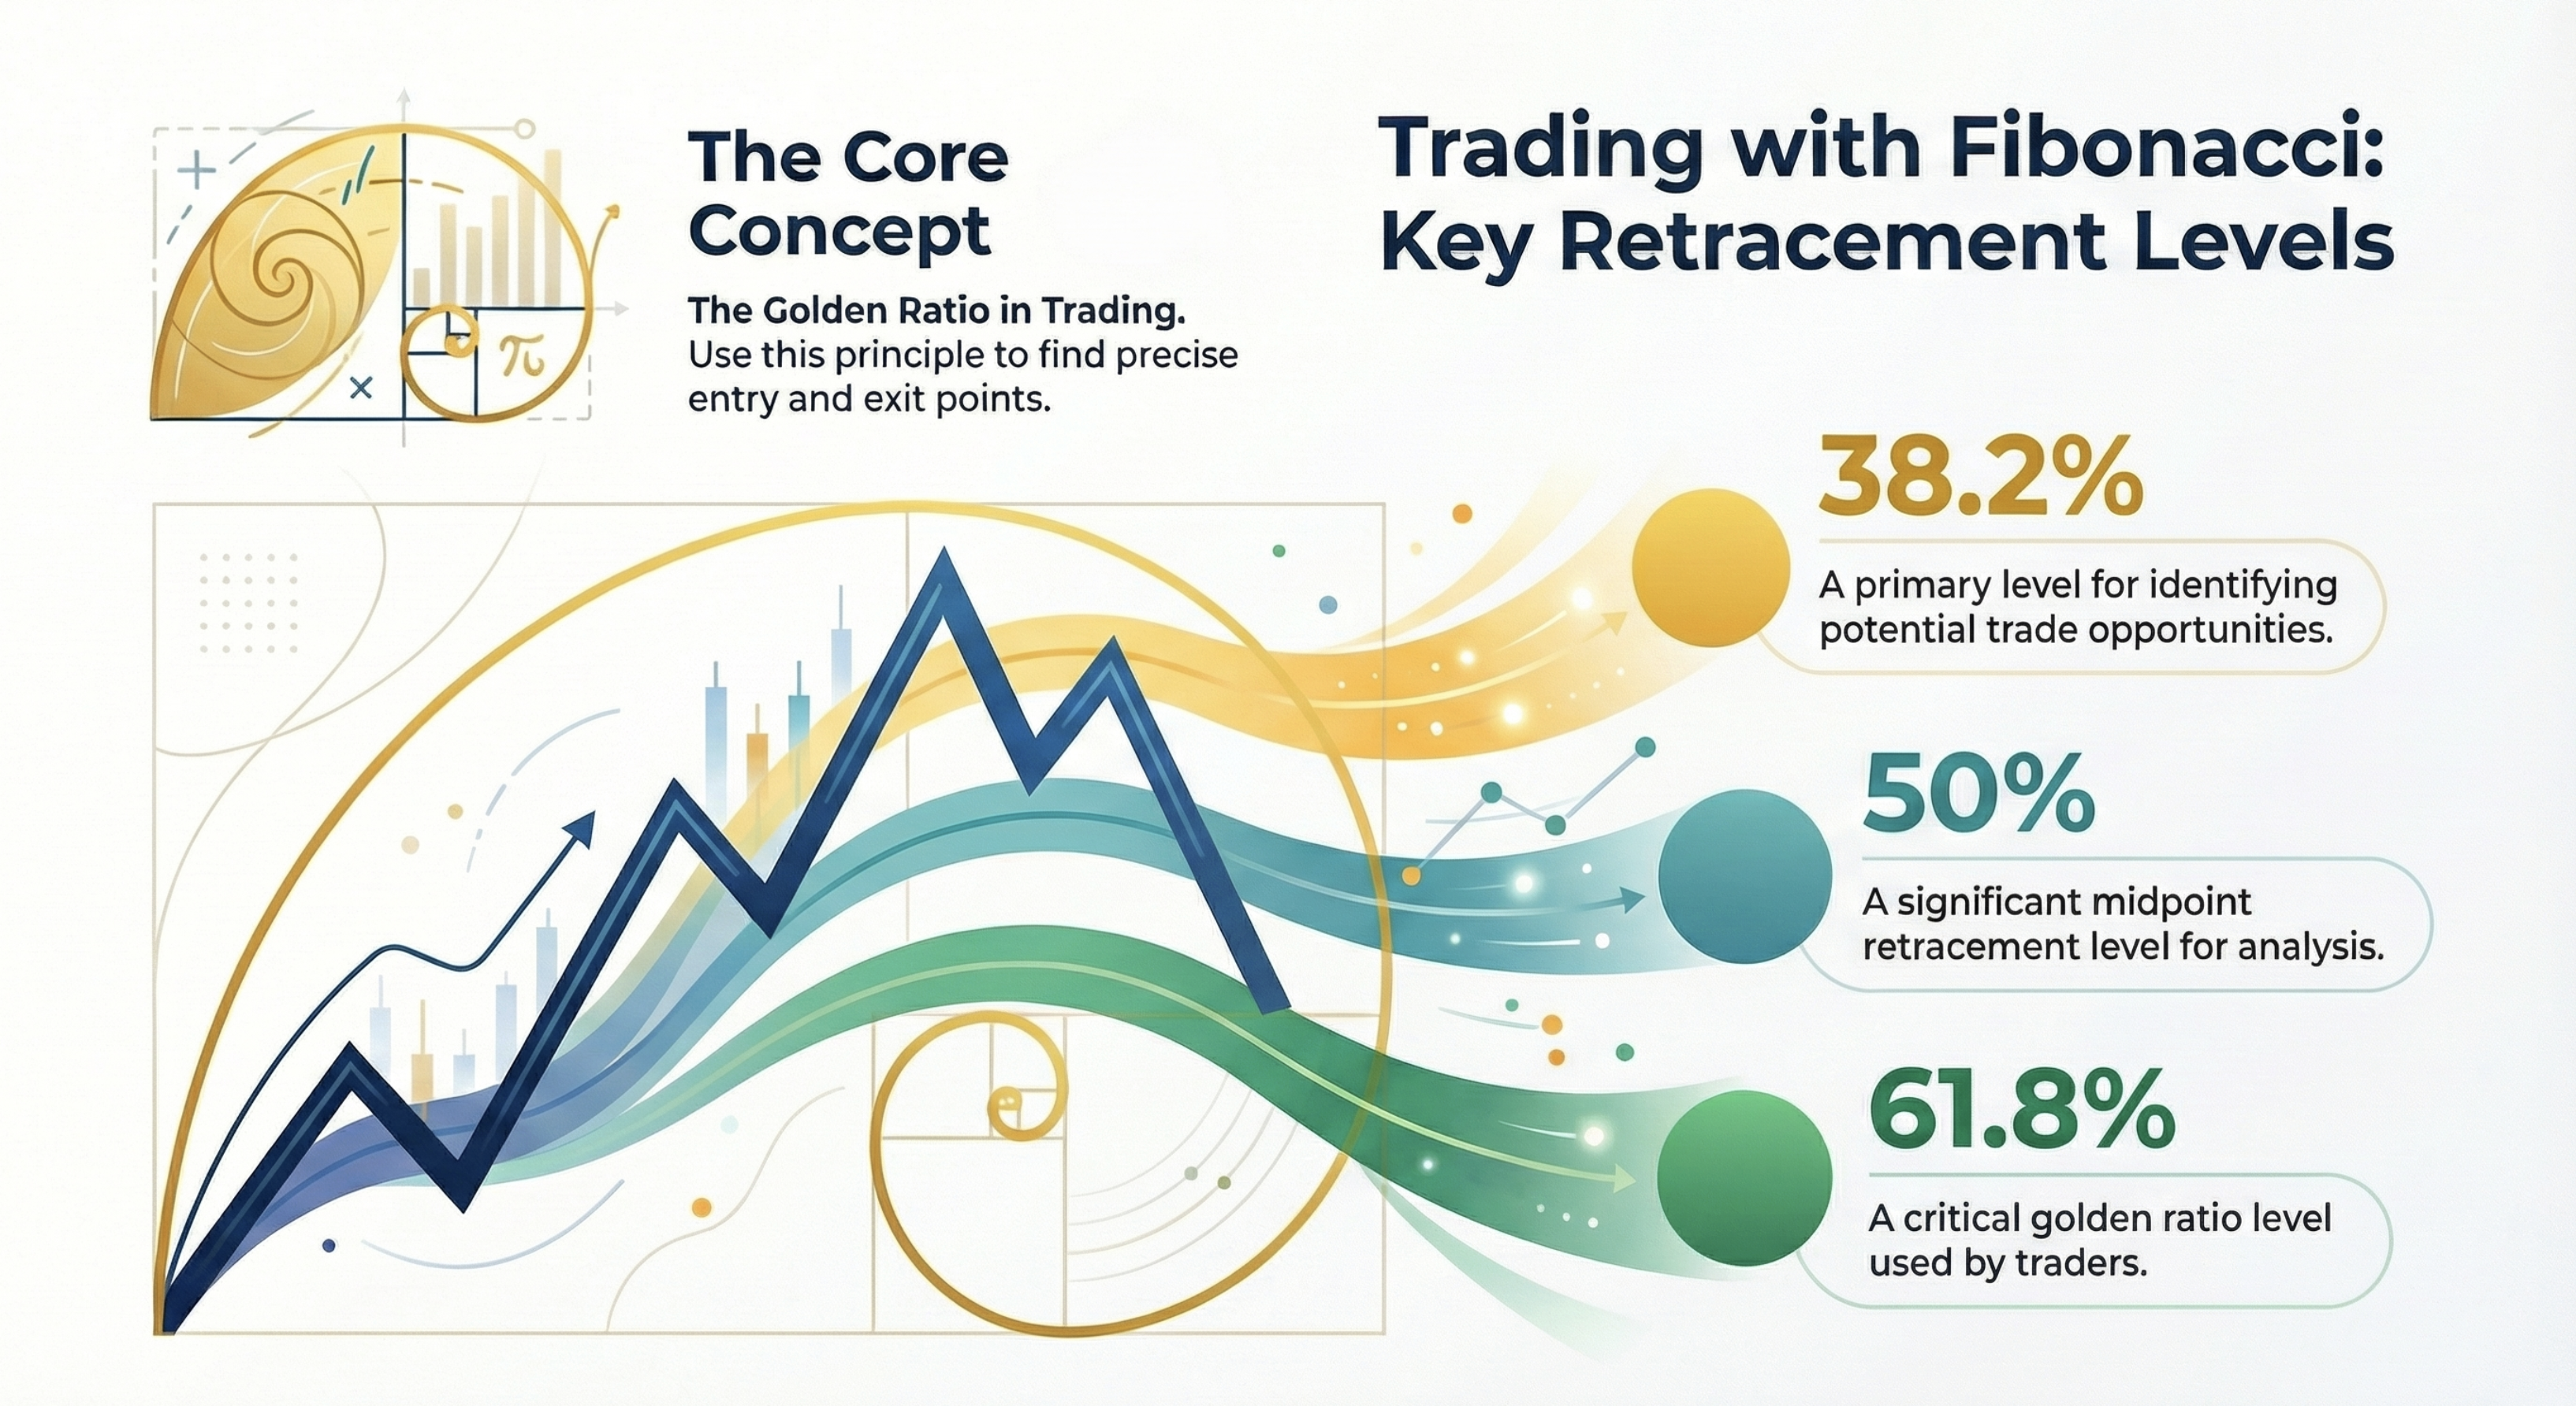
Fibonacci retracements use mathematical ratios to identify potential support and resistance levels in trading. The key levels are: 38.2% (shallow pullback in strong trends), 50% (psychological level), 61.8% (the "golden ratio" and most important level), and 78.6% (deep retracement). To use them: (1) identify the trend direction, (2) draw from swing low to swing high (uptrend) or high to low (downtrend), (3) wait for price to reach a Fib level, (4) confirm with candlestick patterns before entering. Place stop-loss below the next Fib level and use extensions (127.2%, 161.8%) for profit targets. The 61.8% level often provides the best risk-reward for trend continuation trades.
6 Steps to Trade with Fibonacci
Identify the Trend
Before drawing Fibonacci levels, determine whether the market is in an uptrend or downtrend. Look at the higher timeframe to confirm the primary direction.
Find Swing Points
Locate the most recent significant swing high and swing low. These should be clear turning points, not minor fluctuations.
Draw Fibonacci Retracement
In an uptrend, draw from swing low to swing high. In a downtrend, draw from swing high to swing low. Most charting platforms have a Fibonacci tool.
Identify Key Levels
Focus on 38.2%, 50%, and 61.8% retracement levels. The 61.8% (golden ratio) is often the most significant for reversals.
Wait for Confirmation
Don't enter just because price reaches a Fib level. Wait for candlestick confirmation like a hammer, engulfing pattern, or pin bar.
Set Stop-Loss & Targets
Place stop-loss below the next Fibonacci level. Use Fibonacci extensions (127.2%, 161.8%) for profit targets.
The Hidden Code of Markets
100% of professional traders use Fibonacci. Master both retracements and extensions with our comprehensive guide.
Why This PDF is a Game-Changer:
- Universal Application - Fibonacci works on every asset class: stocks, crypto, forex, and commodities
- Self-Fulfilling Prophecy - Because every trader watches Fib levels, they become powerful support/resistance zones
- Precision Entries & Exits - Know exactly where to buy, set stop-losses, and take profits using mathematical ratios
- Extension Targets - Learn 127.2%, 161.8%, and 261.8% extensions for profit-taking in trending markets
- Elliott Wave Synergy - Combine Fibonacci with wave counts for exponentially higher accuracy
Fibonacci: The Hidden Code of Markets
Complete PDF Guide - Instant Download
No email required - instant access
Understanding Fibonacci Levels
| Level | Meaning | Best Usage |
|---|---|---|
23.6% | Shallow retracement, very strong trend | Aggressive entries in powerful trends |
38.2% | Common in strong trends, Wave 4 retracements | Primary entry zone in strong moves |
50% | Psychological level (not a true Fib number) | Popular support/resistance area |
61.8% | Golden ratio, most important Fib level | Best entries for Wave 2 retracements |
78.6% | Deep retracement, last chance entry | Final support before trend fails |
Common Mistakes to Avoid
- •Drawing Fib from wrong swing points (use major highs/lows, not minor ones)
- •Entering immediately when price touches a level (wait for confirmation)
- •Using Fibonacci in isolation (combine with patterns, volume, and trends)
- •Ignoring the bigger picture (check higher timeframes first)
Ready to Practice?
Apply what you've learned with paper trading. Test your strategies without risking real money.
TradingView Setup
Free platform guide with 3 essential indicators
30 Min/Day Practice
Build real skills with structured daily practice
Risk-Free Learning
Test strategies before committing real capital