Daily Curated Charts with Expert Analysis
See the markets through professional eyes. Get daily handpicked charts with Elliott Wave counts, Fibonacci levels, and pattern analysis that shows you exactly what experienced traders look for.
Screening runs on AI. The analysis on every chart is done by hand.
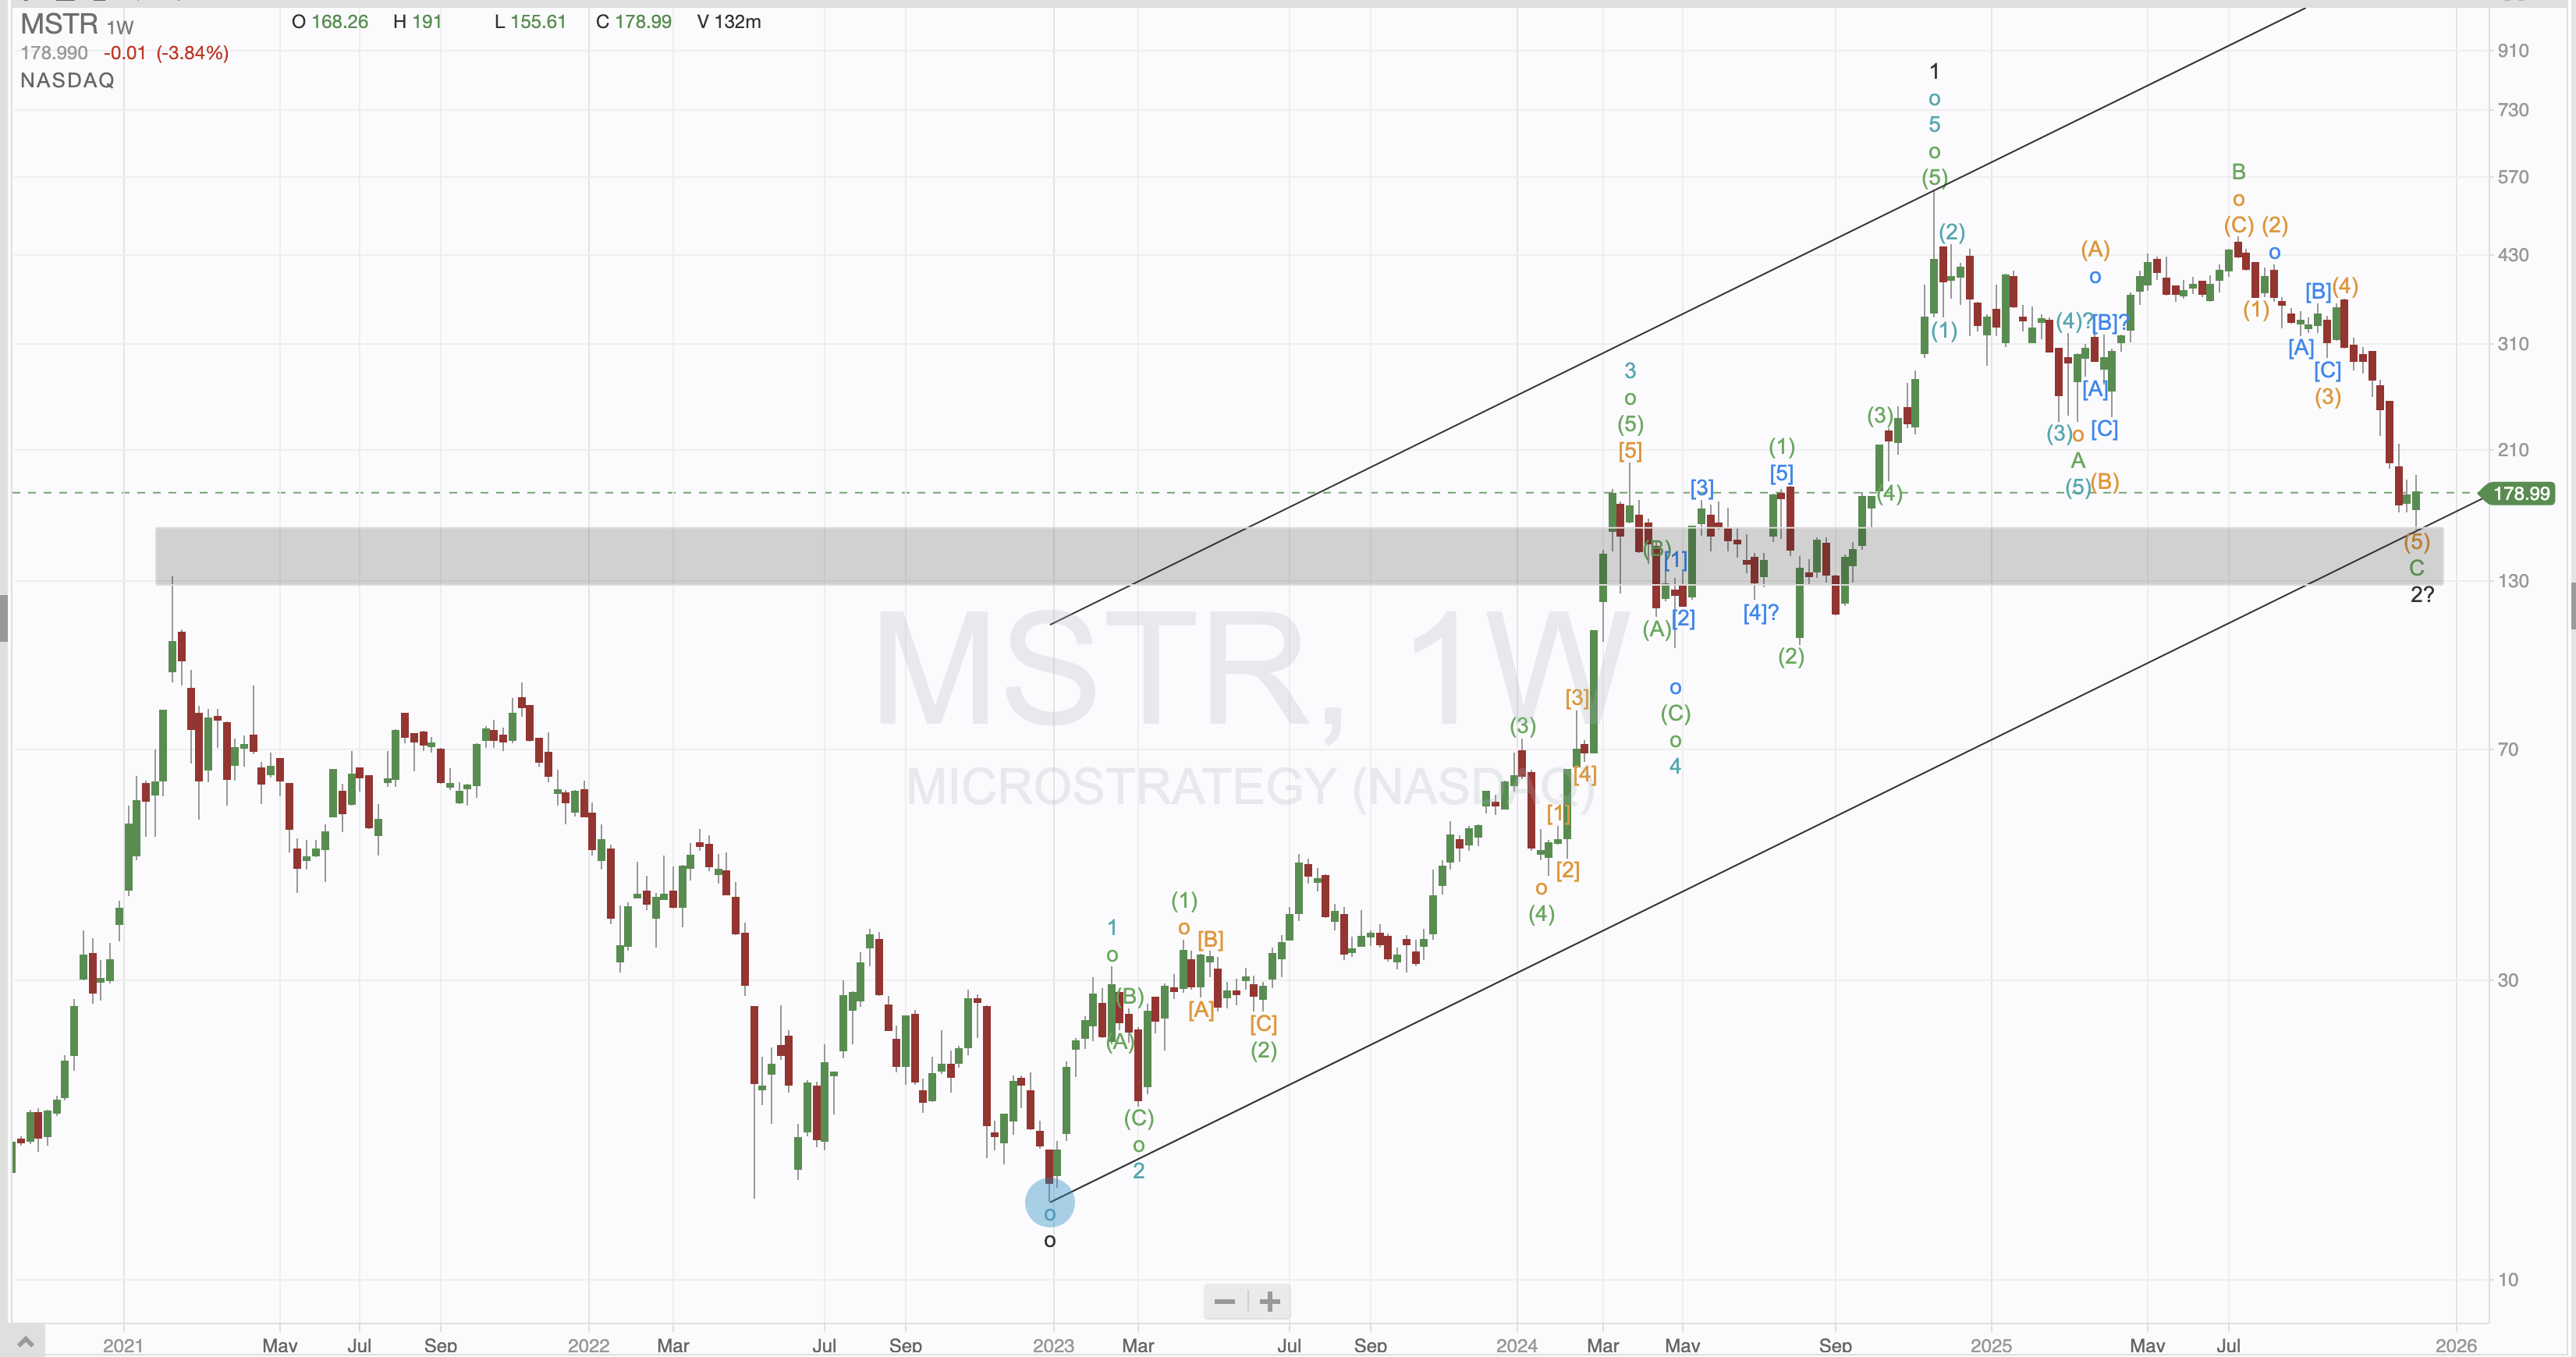
Example: MSTR Weekly with Elliott Wave counts, ABC corrections, and key support zones
Every Chart Comes Fully Annotated
Professional analysis with clear markings so you can see exactly what we see
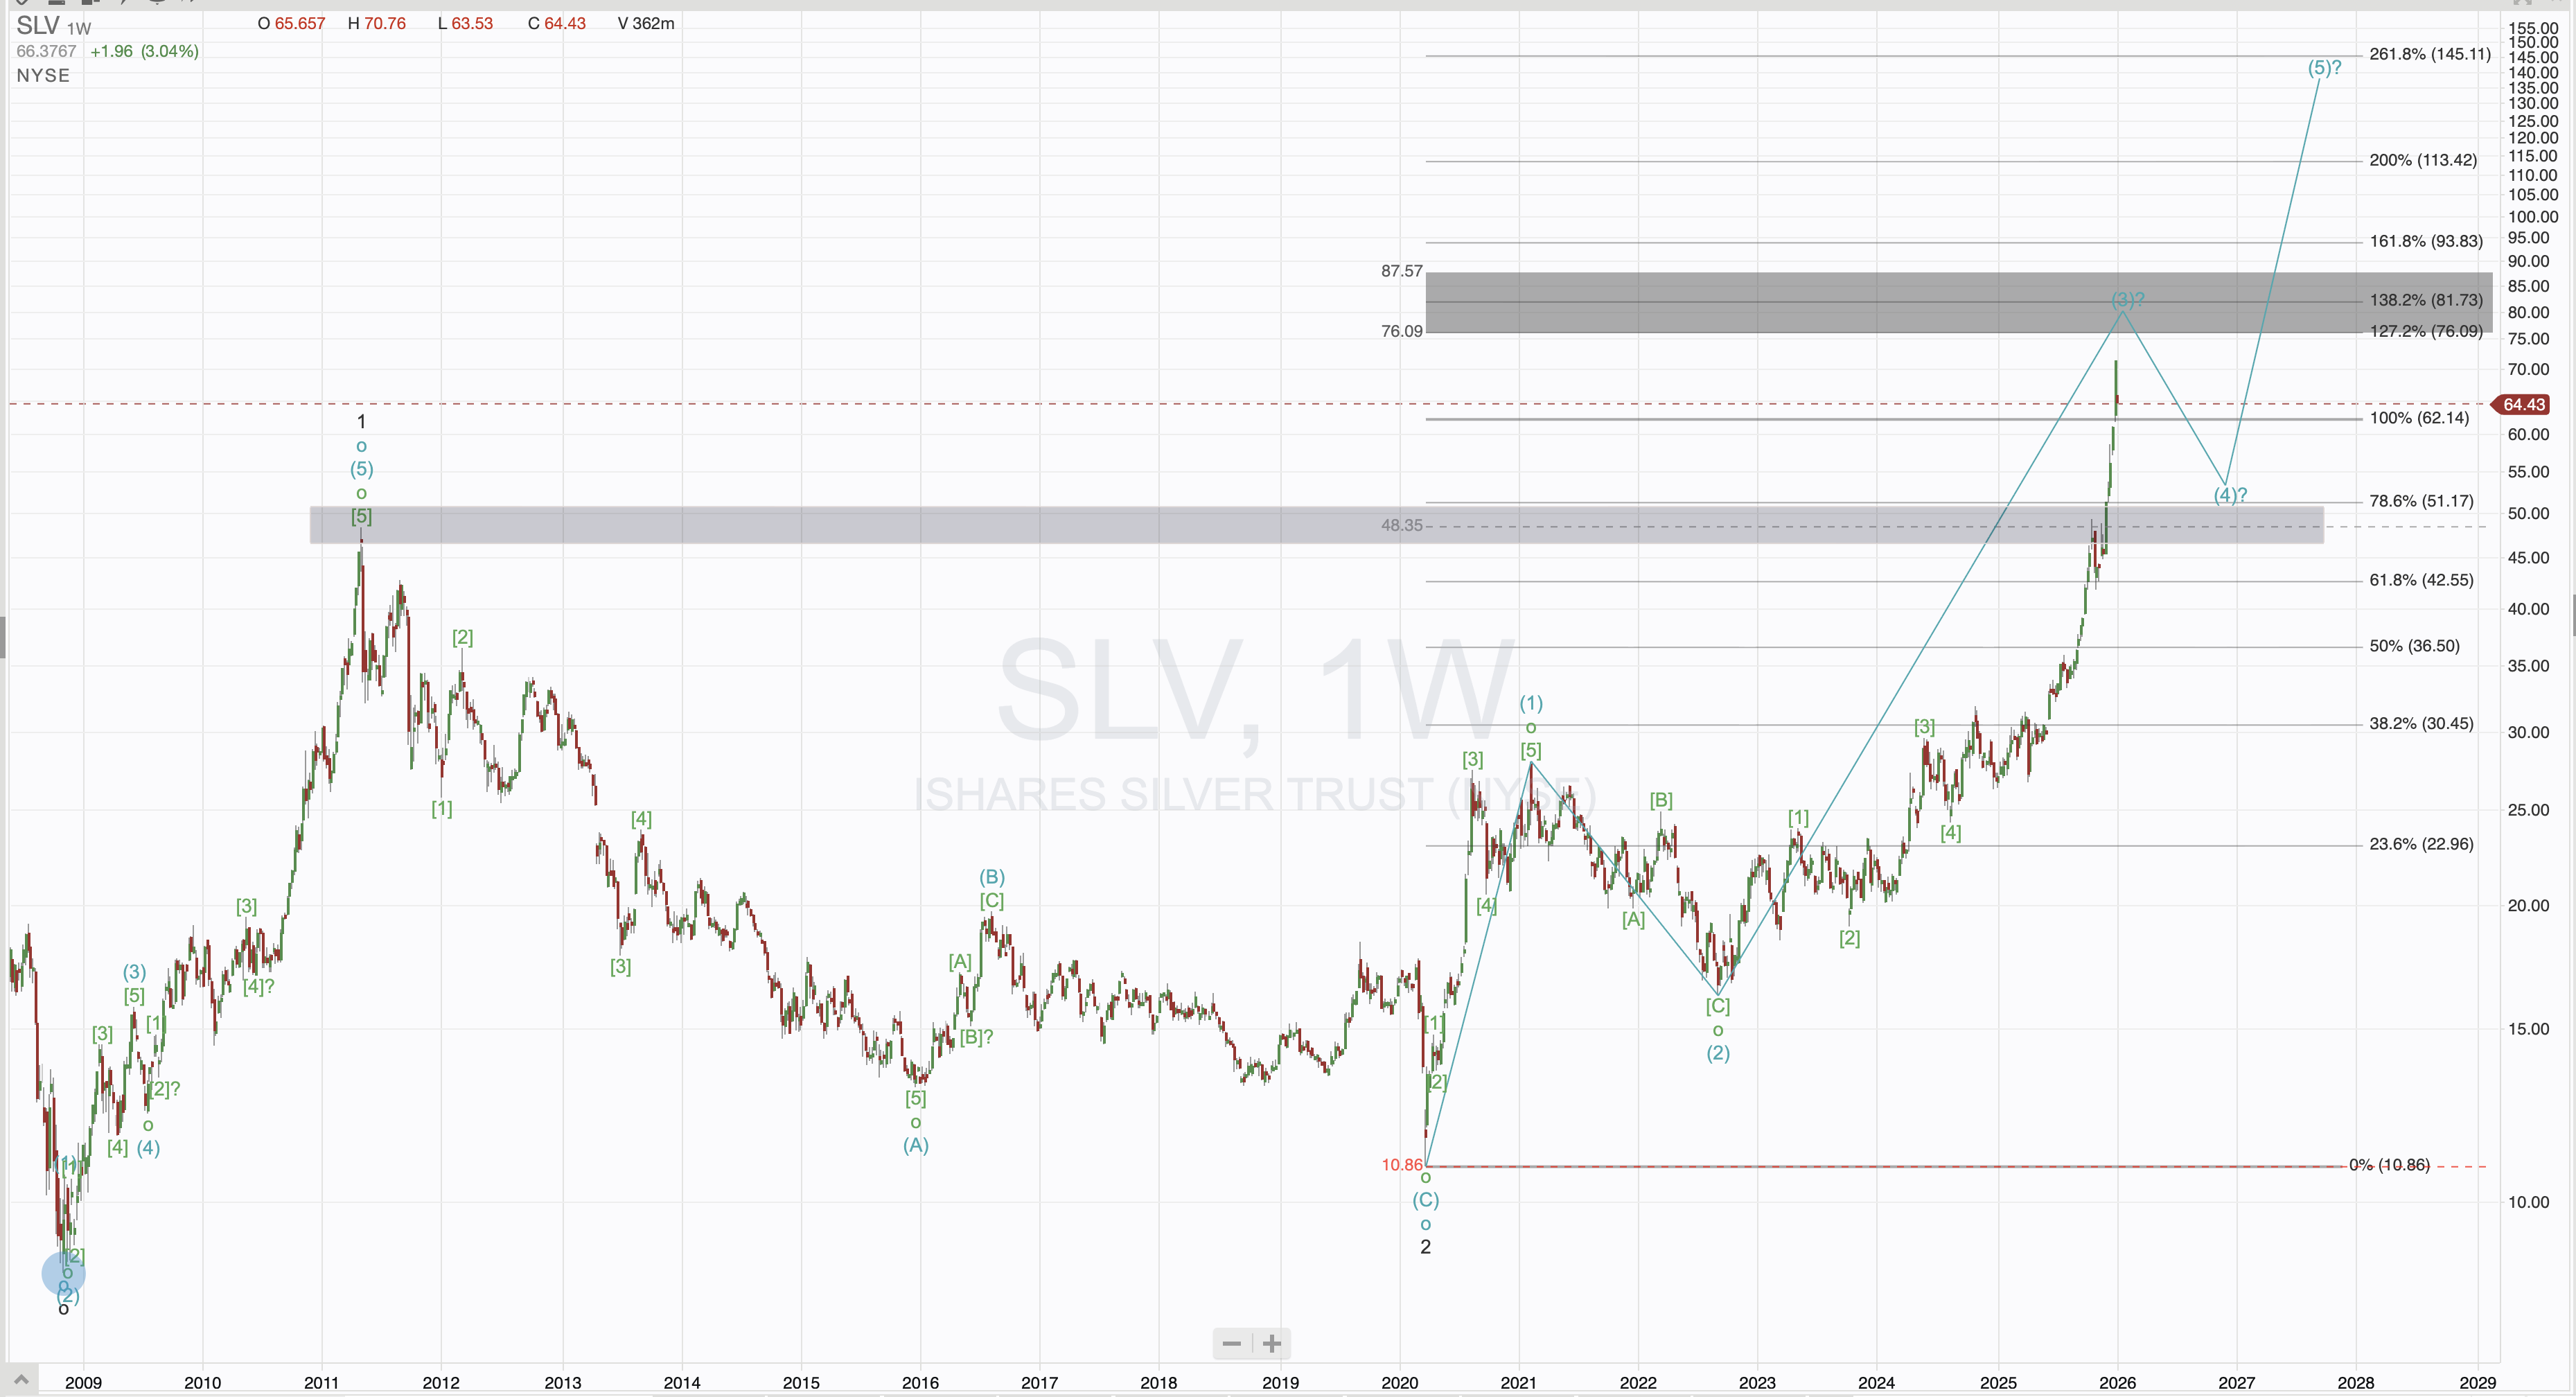
Chart Annotations Explained
Wave Labels (1-5, A-B-C)
Clear impulse and corrective wave counts
Support/Resistance Zones
Key horizontal levels highlighted in gray
Trend Channels
Diagonal trend lines showing market direction
Fibonacci Levels
Key retracement and extension targets
Want to build wave counts like these yourself? We use WaveBasis's automated Elliott Wave software to accelerate our analysis, then verify every count by hand.
Learn more hereAffiliate link: we may earn a commission if you subscribe, at no extra cost to you.
Bridging Traditional Markets & Crypto
Our analysis covers both worlds - including Bitcoin proxy stocks like MSTR that let you trade crypto exposure through traditional brokerage accounts
Why We Analyze MSTR
MicroStrategy (MSTR) holds over 200,000 Bitcoin on its balance sheet, making it one of the best ways to gain leveraged Bitcoin exposure through a stock. Our Elliott Wave analysis helps you time entries and exits on this high-volatility asset.
- Trade crypto exposure in your IRA or 401(k)
- No crypto exchange account required
- Leveraged moves - MSTR often moves 2-3x Bitcoin
- Apply same Elliott Wave techniques to both
This Week's Featured Analysis
Every week, members receive comprehensive chart breakdowns like this during our Zoom training calls
BTCUSD 4-Day Analysis
Elliott Wave Count Update
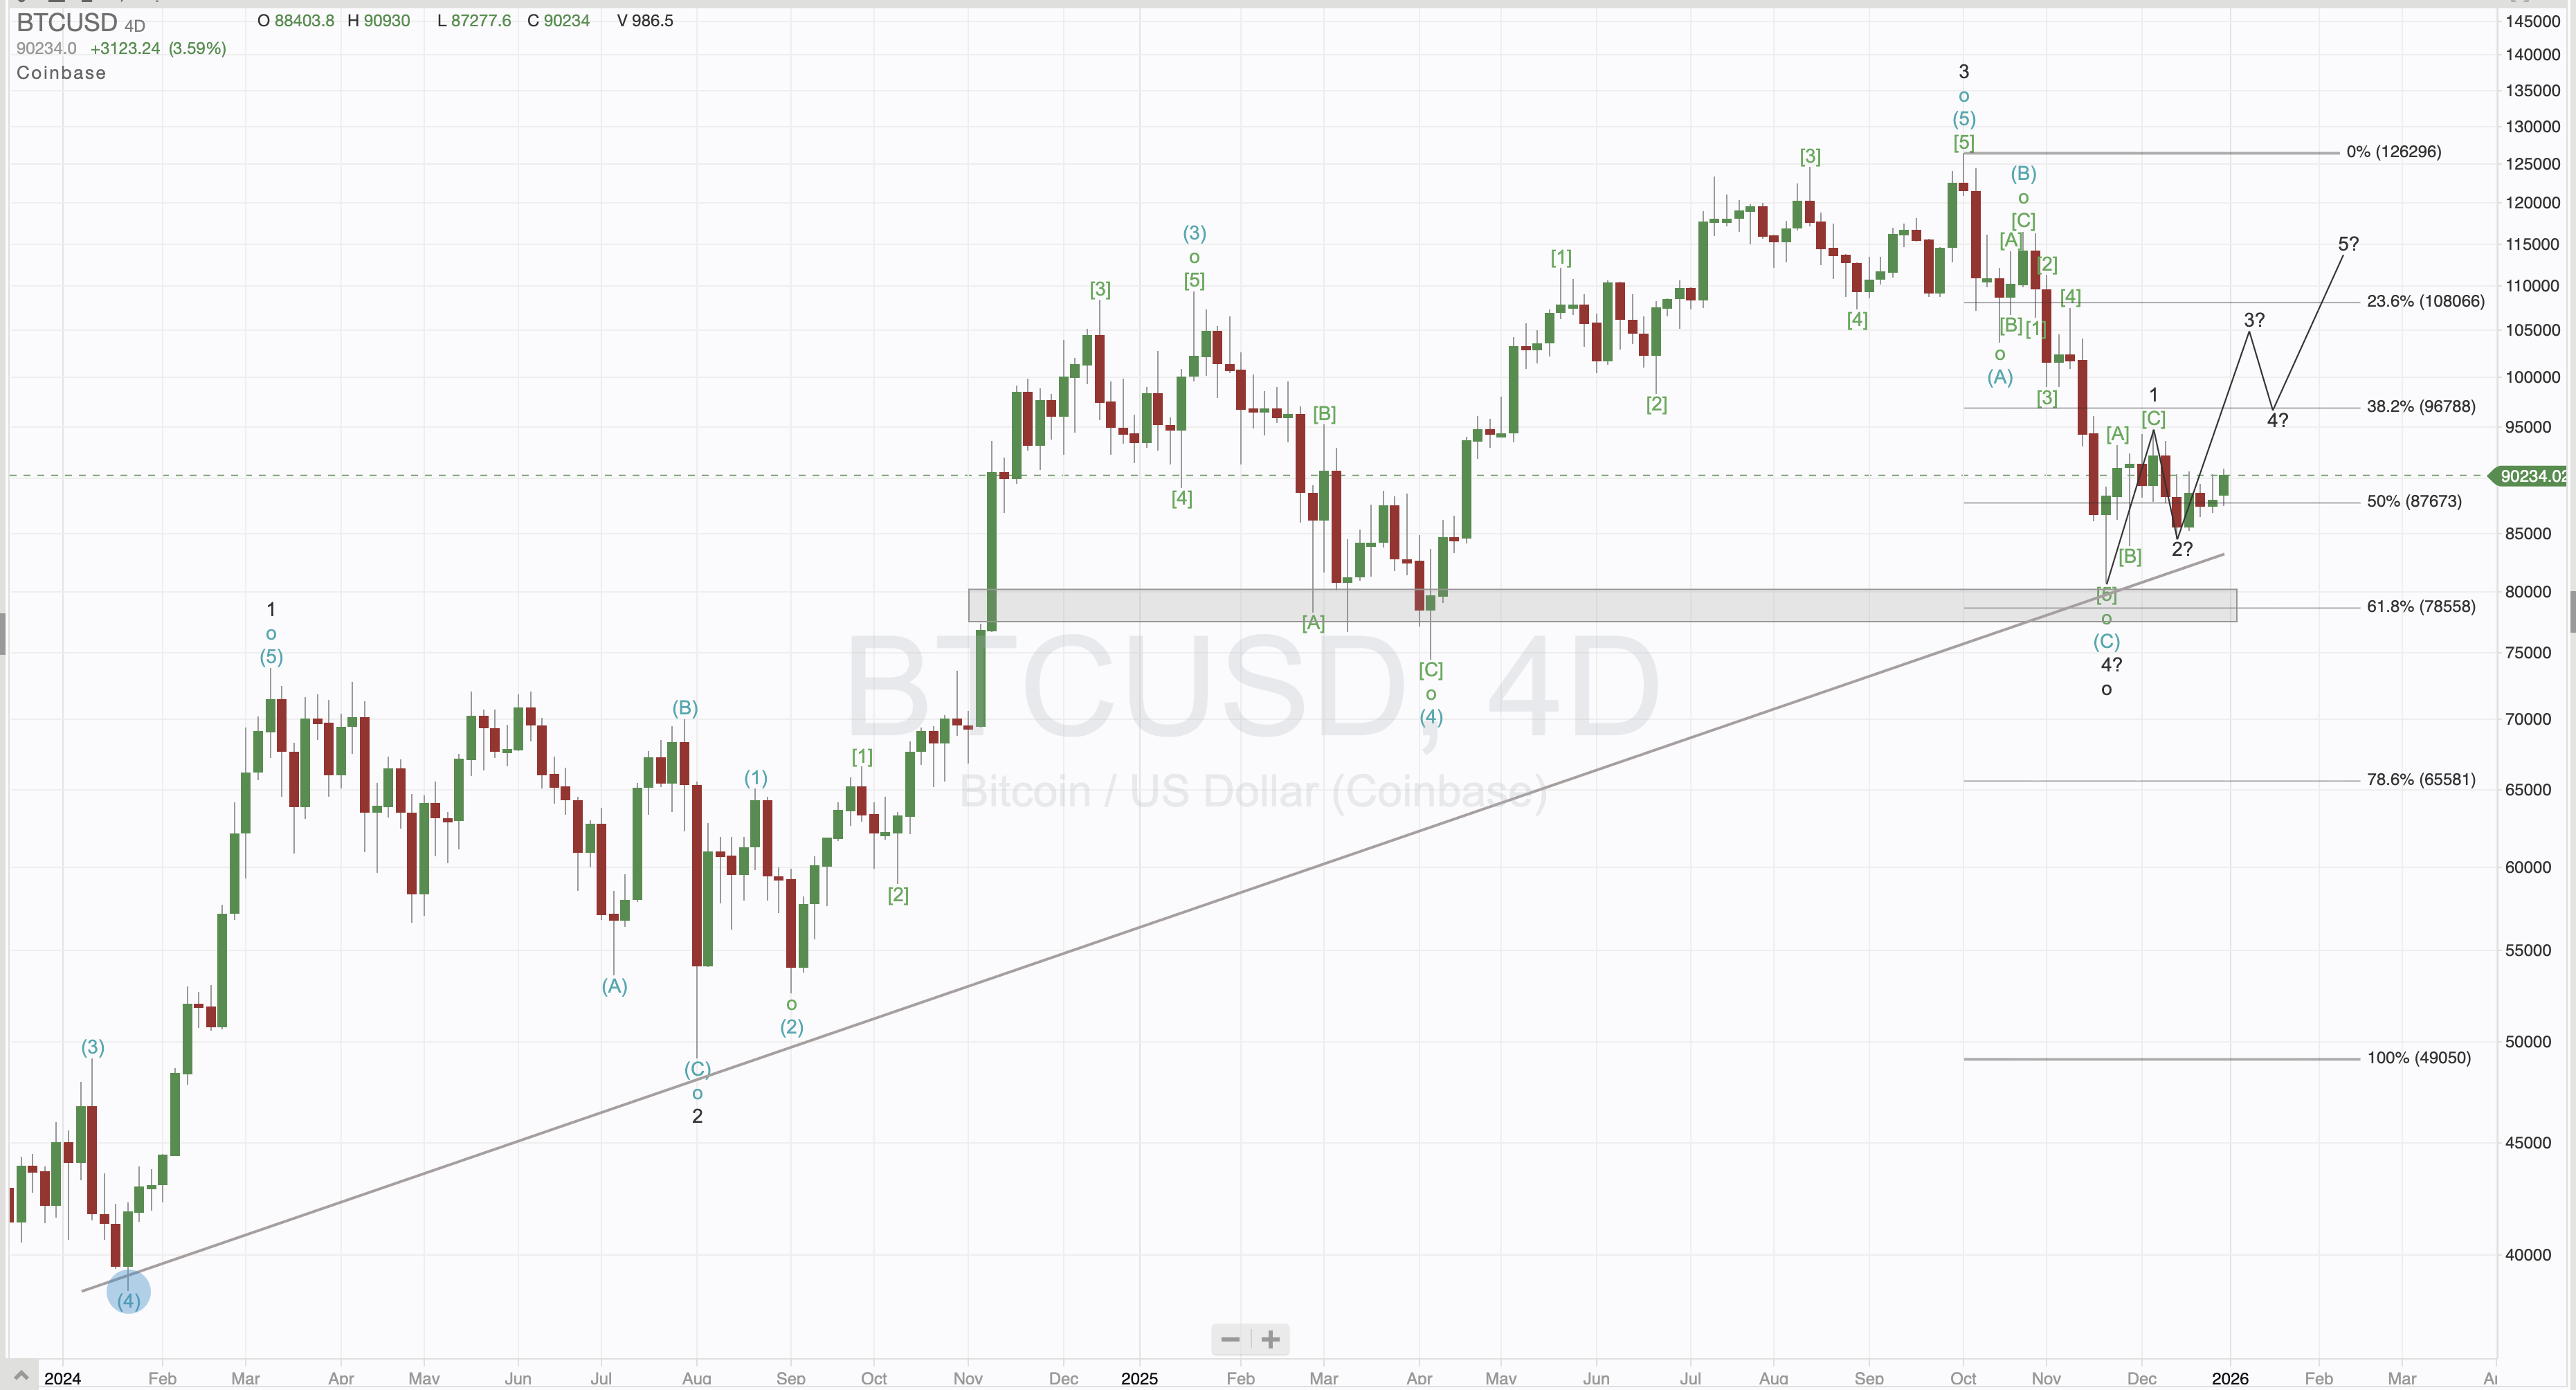
Weekly Zoom Breakdown
Current wave count and where we are in the cycle
Key support and resistance levels to watch
Fibonacci targets for the next move
Risk management and stop placement
Join our weekly Zoom calls to learn how we analyze charts like this in real-time.
See How We Analyze Markets
Download our professional Bitcoin & MSTR thesis with Elliott Wave counts, Gann Fan geometry, and Fibonacci analysis. See exactly what you'll get as a member.
What's Included in Curated Charts
Professional-grade chart analysis delivered daily to accelerate your learning
Daily Chart Reviews
Handpicked charts across stocks and crypto with professional annotations highlighting key levels and patterns
Multi-Timeframe Analysis
See how patterns align across daily, weekly, and monthly timeframes for stronger conviction trades
Elliott Wave Counts
Professional wave analysis showing where we are in the market cycle and what to expect next
Key Price Levels
Fibonacci retracements, support/resistance zones, and pivot points clearly marked on every chart
Markets We Cover
Stock Charts
- S&P 500 Leaders
- NASDAQ Growth Stocks
- Sector Breakouts
- Blue Chip Setups
Crypto Charts
- Bitcoin Analysis
- Ethereum Structure
- Top Altcoins
- DeFi Tokens
Market Breadth
- Advance/Decline
- New Highs/Lows
- Sector Rotation
- Risk Indicators
Learn to See What Pros See
The difference between amateur and professional traders isn't intelligence - it's pattern recognition. By studying our daily curated charts, you'll develop the same eye for setups that took us 14,000+ hours to build.
Pattern Recognition Training
Each chart teaches you to spot setups faster
Save Research Time
We scan hundreds of charts so you don't have to
Build Your Watchlist
Discover stocks and crypto before they break out
Want to run your own counts between updates?
Sign up hereCancel anytime
Your Analysis Team

John Utley · EasyCharts
EasyCharts specializes in Elliott Wave Theory, Fibonacci trading strategies, and risk-defined entry/exit methods. Every analysis starts with the same question: where is this trade wrong? Risk is defined before any setup is shared.
Areas of Expertise
Risk-First
Stop-Loss on Every Setup
Elliott Wave
& Fibonacci Analysis
Weekly Zoom
Live Q&A Sessions
Sunday Reports
Plan the Week Ahead
Frequently Asked Questions
How often are new charts published?
We publish fresh chart analysis daily on trading days, with comprehensive weekend reviews covering the week ahead. You'll never miss an important setup.
What technical methods are used in the analysis?
Our charts feature Elliott Wave counts, Fibonacci retracements and extensions, horizontal support/resistance, volume analysis, and classic chart patterns like cups, saucers, and breakouts.
Can I request analysis on specific stocks or crypto?
Yes! Members can submit chart requests and we'll prioritize popular requests in our daily analysis. Personal Coaching members get priority attention.
How is this different from the Buy/Sell Signals?
Curated Charts is educational - you learn to see what we see. Buy/Sell Signals are actionable alerts. Many members use both: charts for learning and signals for trade ideas.
Ready to See the Markets Differently?
Start receiving daily professional chart analysis and accelerate your pattern recognition skills.