
Quick Summary
Technical analysis studies price movements and chart patterns to forecast future price direction. Core concepts include: trend analysis (identifying uptrends, downtrends, sideways markets), support and resistance (key price levels where buying/selling pressure concentrates), chart patterns (cup & handle, head & shoulders, triangles), and entry/exit timing using confirmations. Price action is the most important indicator, supported by volume analysis. Methods like Elliott Wave Theory and Fibonacci retracements provide additional precision for wave structures and key price levels. Basic concepts can be learned in weeks, but mastery takes years. Focus on one or two methods and perfect them. Technical analysis works on all markets (stocks, crypto, forex) because it's based on human psychology.
Core Concepts to Master
Start with these fundamentals before moving to advanced techniques
Trend Analysis
Learn to identify uptrends, downtrends, and sideways markets
Support & Resistance
Find key price levels where buying and selling pressure concentrate
Chart Patterns
Recognize formations like cup & handle, head & shoulders, triangles
Entry & Exit Points
Time your trades using technical signals and confirmations
Key Chart Patterns Every Trader Should Know
Mastering these chart patterns gives you a significant edge in identifying high-probability trade setups across any market.
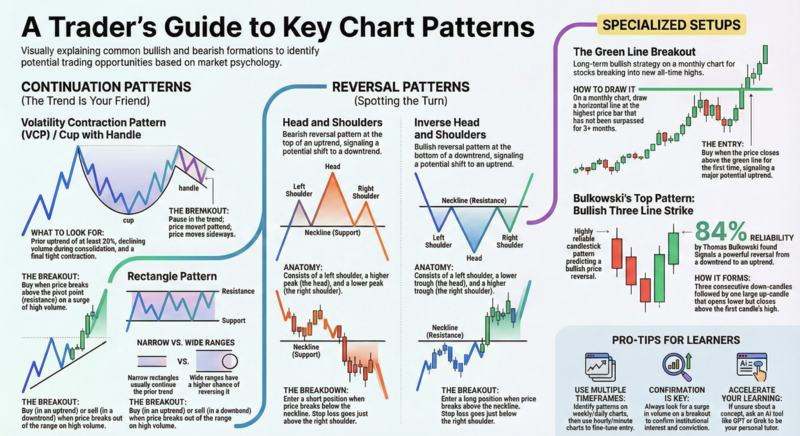
What You'll Learn
The EasyCharts Approach
We focus on proven, time-tested methods that have worked for decades:
Elliott Wave Theory
Understand market structure through wave patterns
Fibonacci Analysis
Identify key support, resistance, and targets
Classic Patterns
Cup & handle, horizontal breakouts, and more
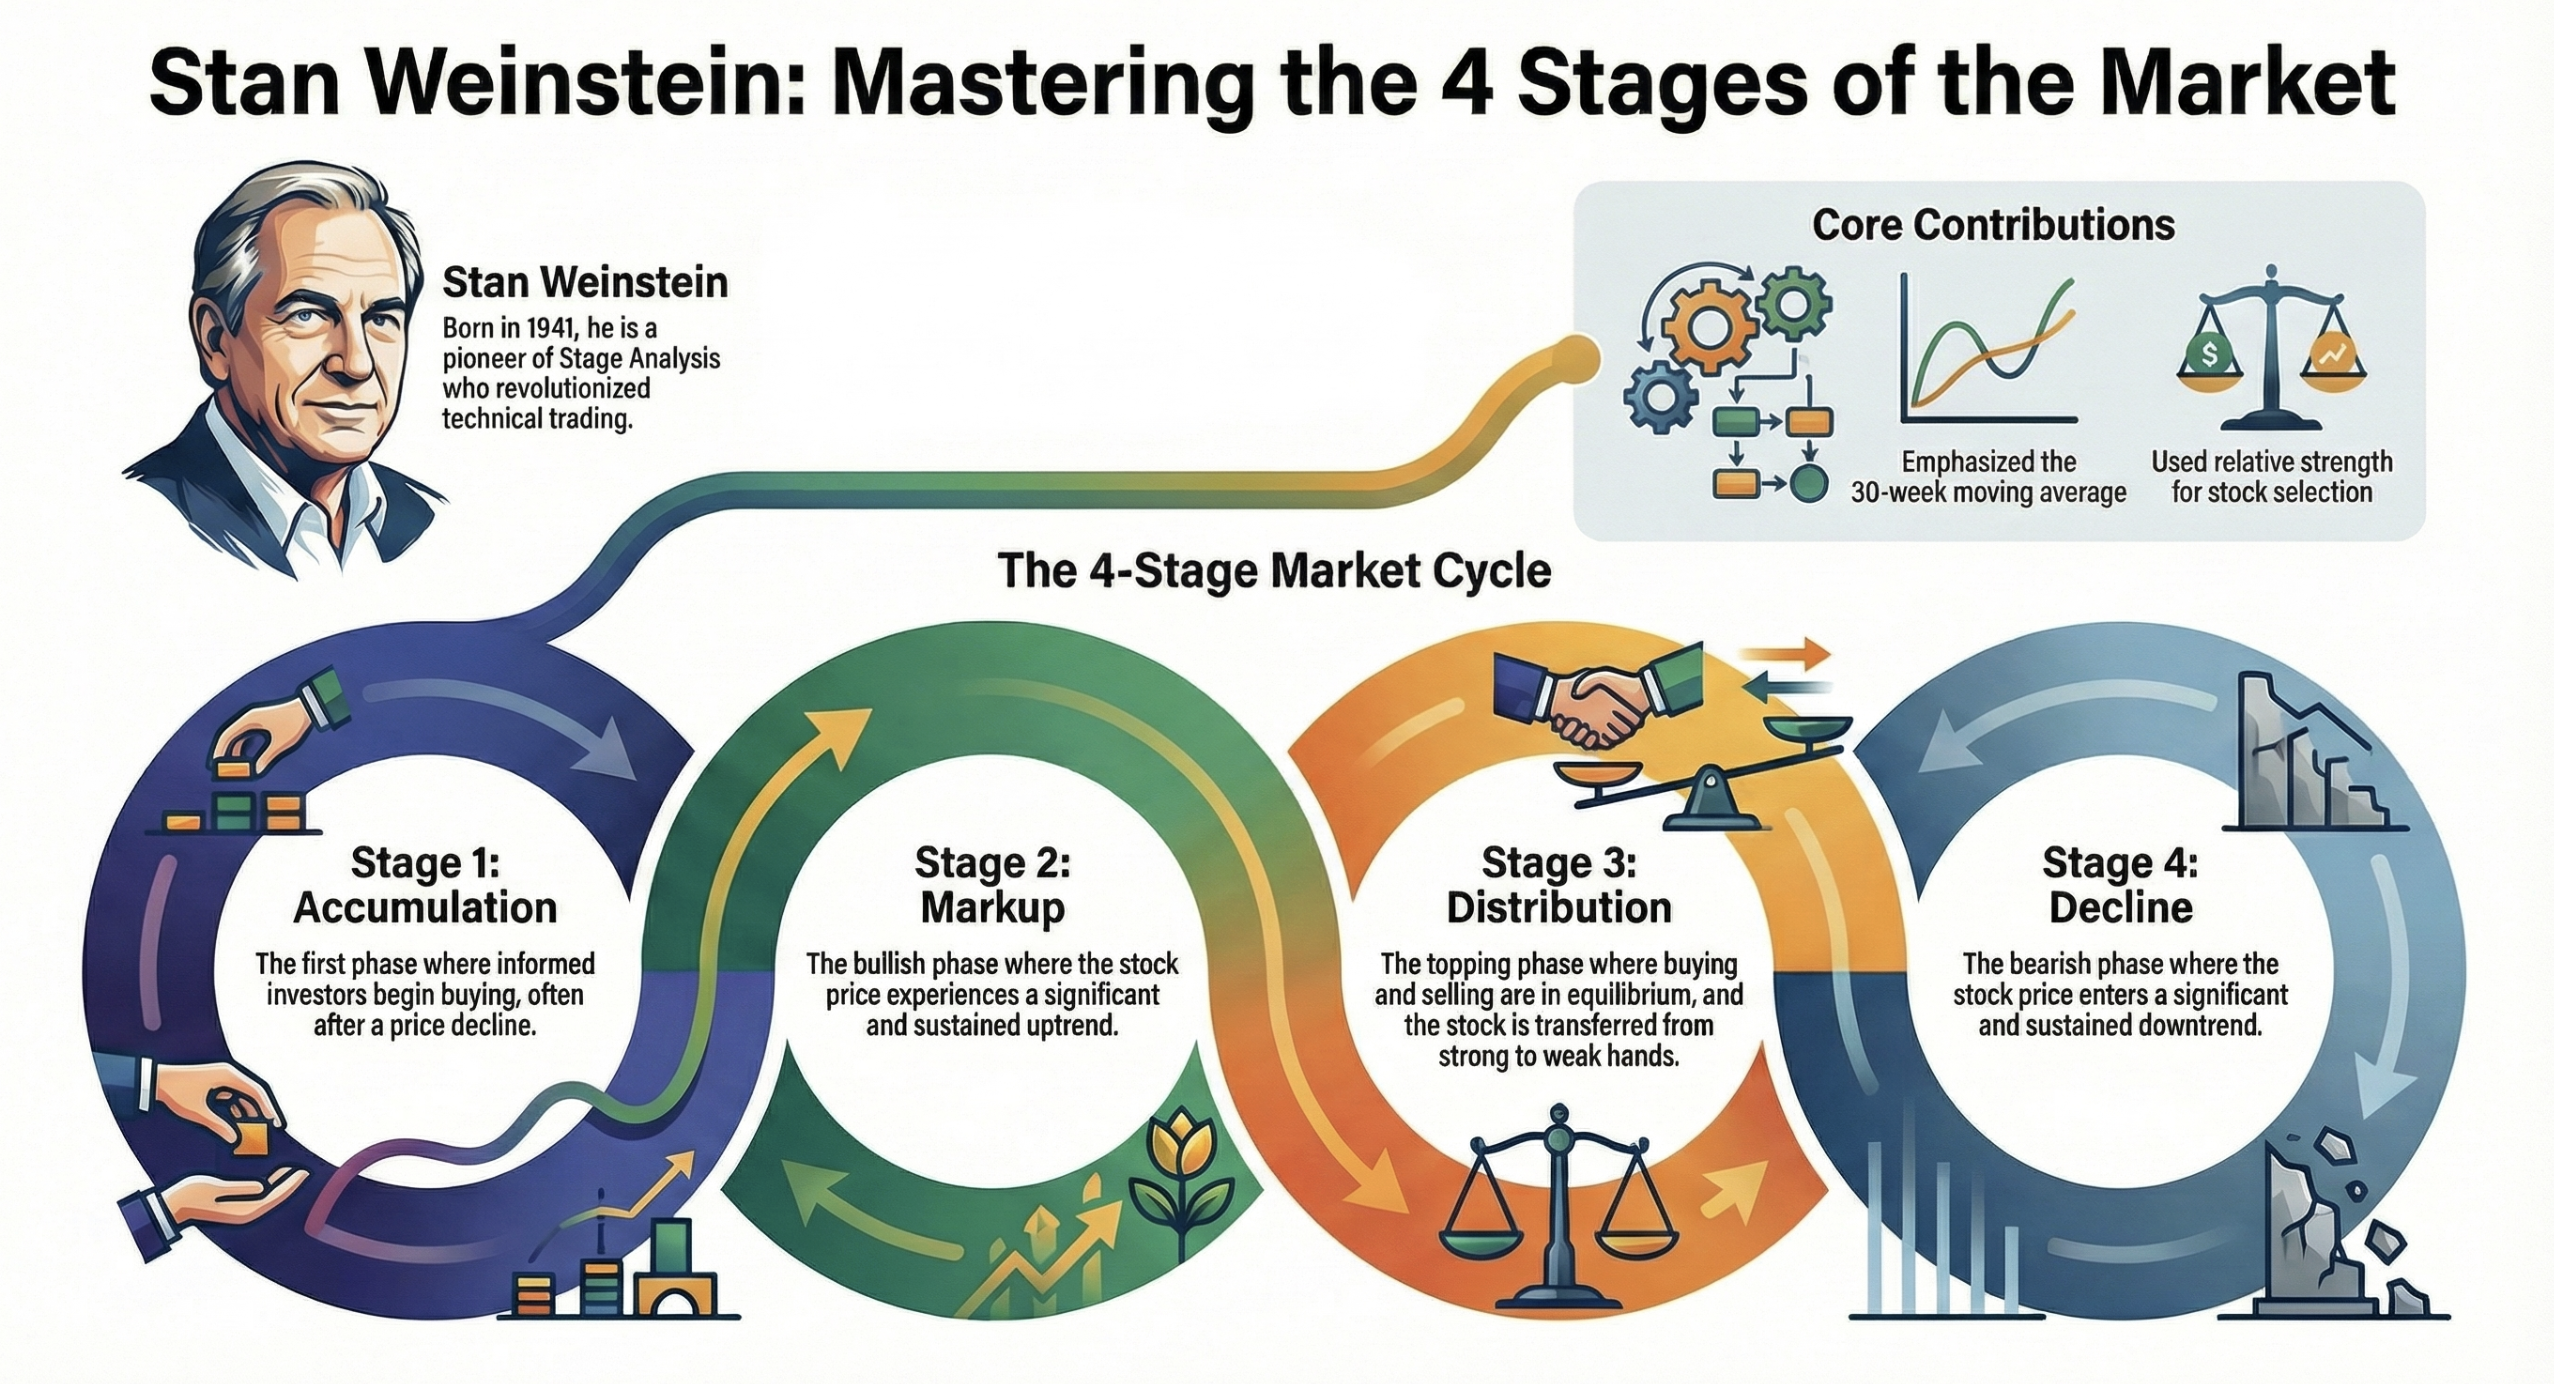
Stan Weinstein's 4-Stage Market Cycle
Understanding where a stock sits in its market cycle is crucial for timing entries and exits. This legendary framework helps you identify the optimal moments to buy and sell.
Frequently Asked Questions
What is technical analysis?
Technical analysis is the study of price movements and chart patterns to forecast future price direction. It's based on the idea that price patterns repeat because they reflect human psychology, which doesn't change over time.
Does technical analysis really work?
Yes, when applied with proper risk management. Technical analysis identifies probabilities, not certainties. Successful traders use it to find high-probability setups and manage risk, not to predict the future perfectly.
What are the most important technical indicators?
Price action itself is the most important indicator. Beyond that, focus on support/resistance levels, trend lines, and volume. Elliott Wave and Fibonacci are powerful tools for identifying wave structures and key price levels.
How long does it take to learn technical analysis?
Basic concepts can be learned in weeks, but mastery takes years of practice. Focus on one or two methods (like Elliott Wave + Fibonacci) and perfect them rather than trying to learn everything at once.
Is technical analysis the same for stocks and crypto?
The core principles apply to all markets because they're based on human psychology. However, crypto markets are more volatile and trade 24/7, which affects pattern behavior and timeframe selection.
Ready to Practice?
Apply what you've learned with paper trading. Test your strategies without risking real money.
TradingView Setup
Free platform guide with 3 essential indicators
30 Min/Day Practice
Build real skills with structured daily practice
Risk-Free Learning
Test strategies before committing real capital