
Quick Summary
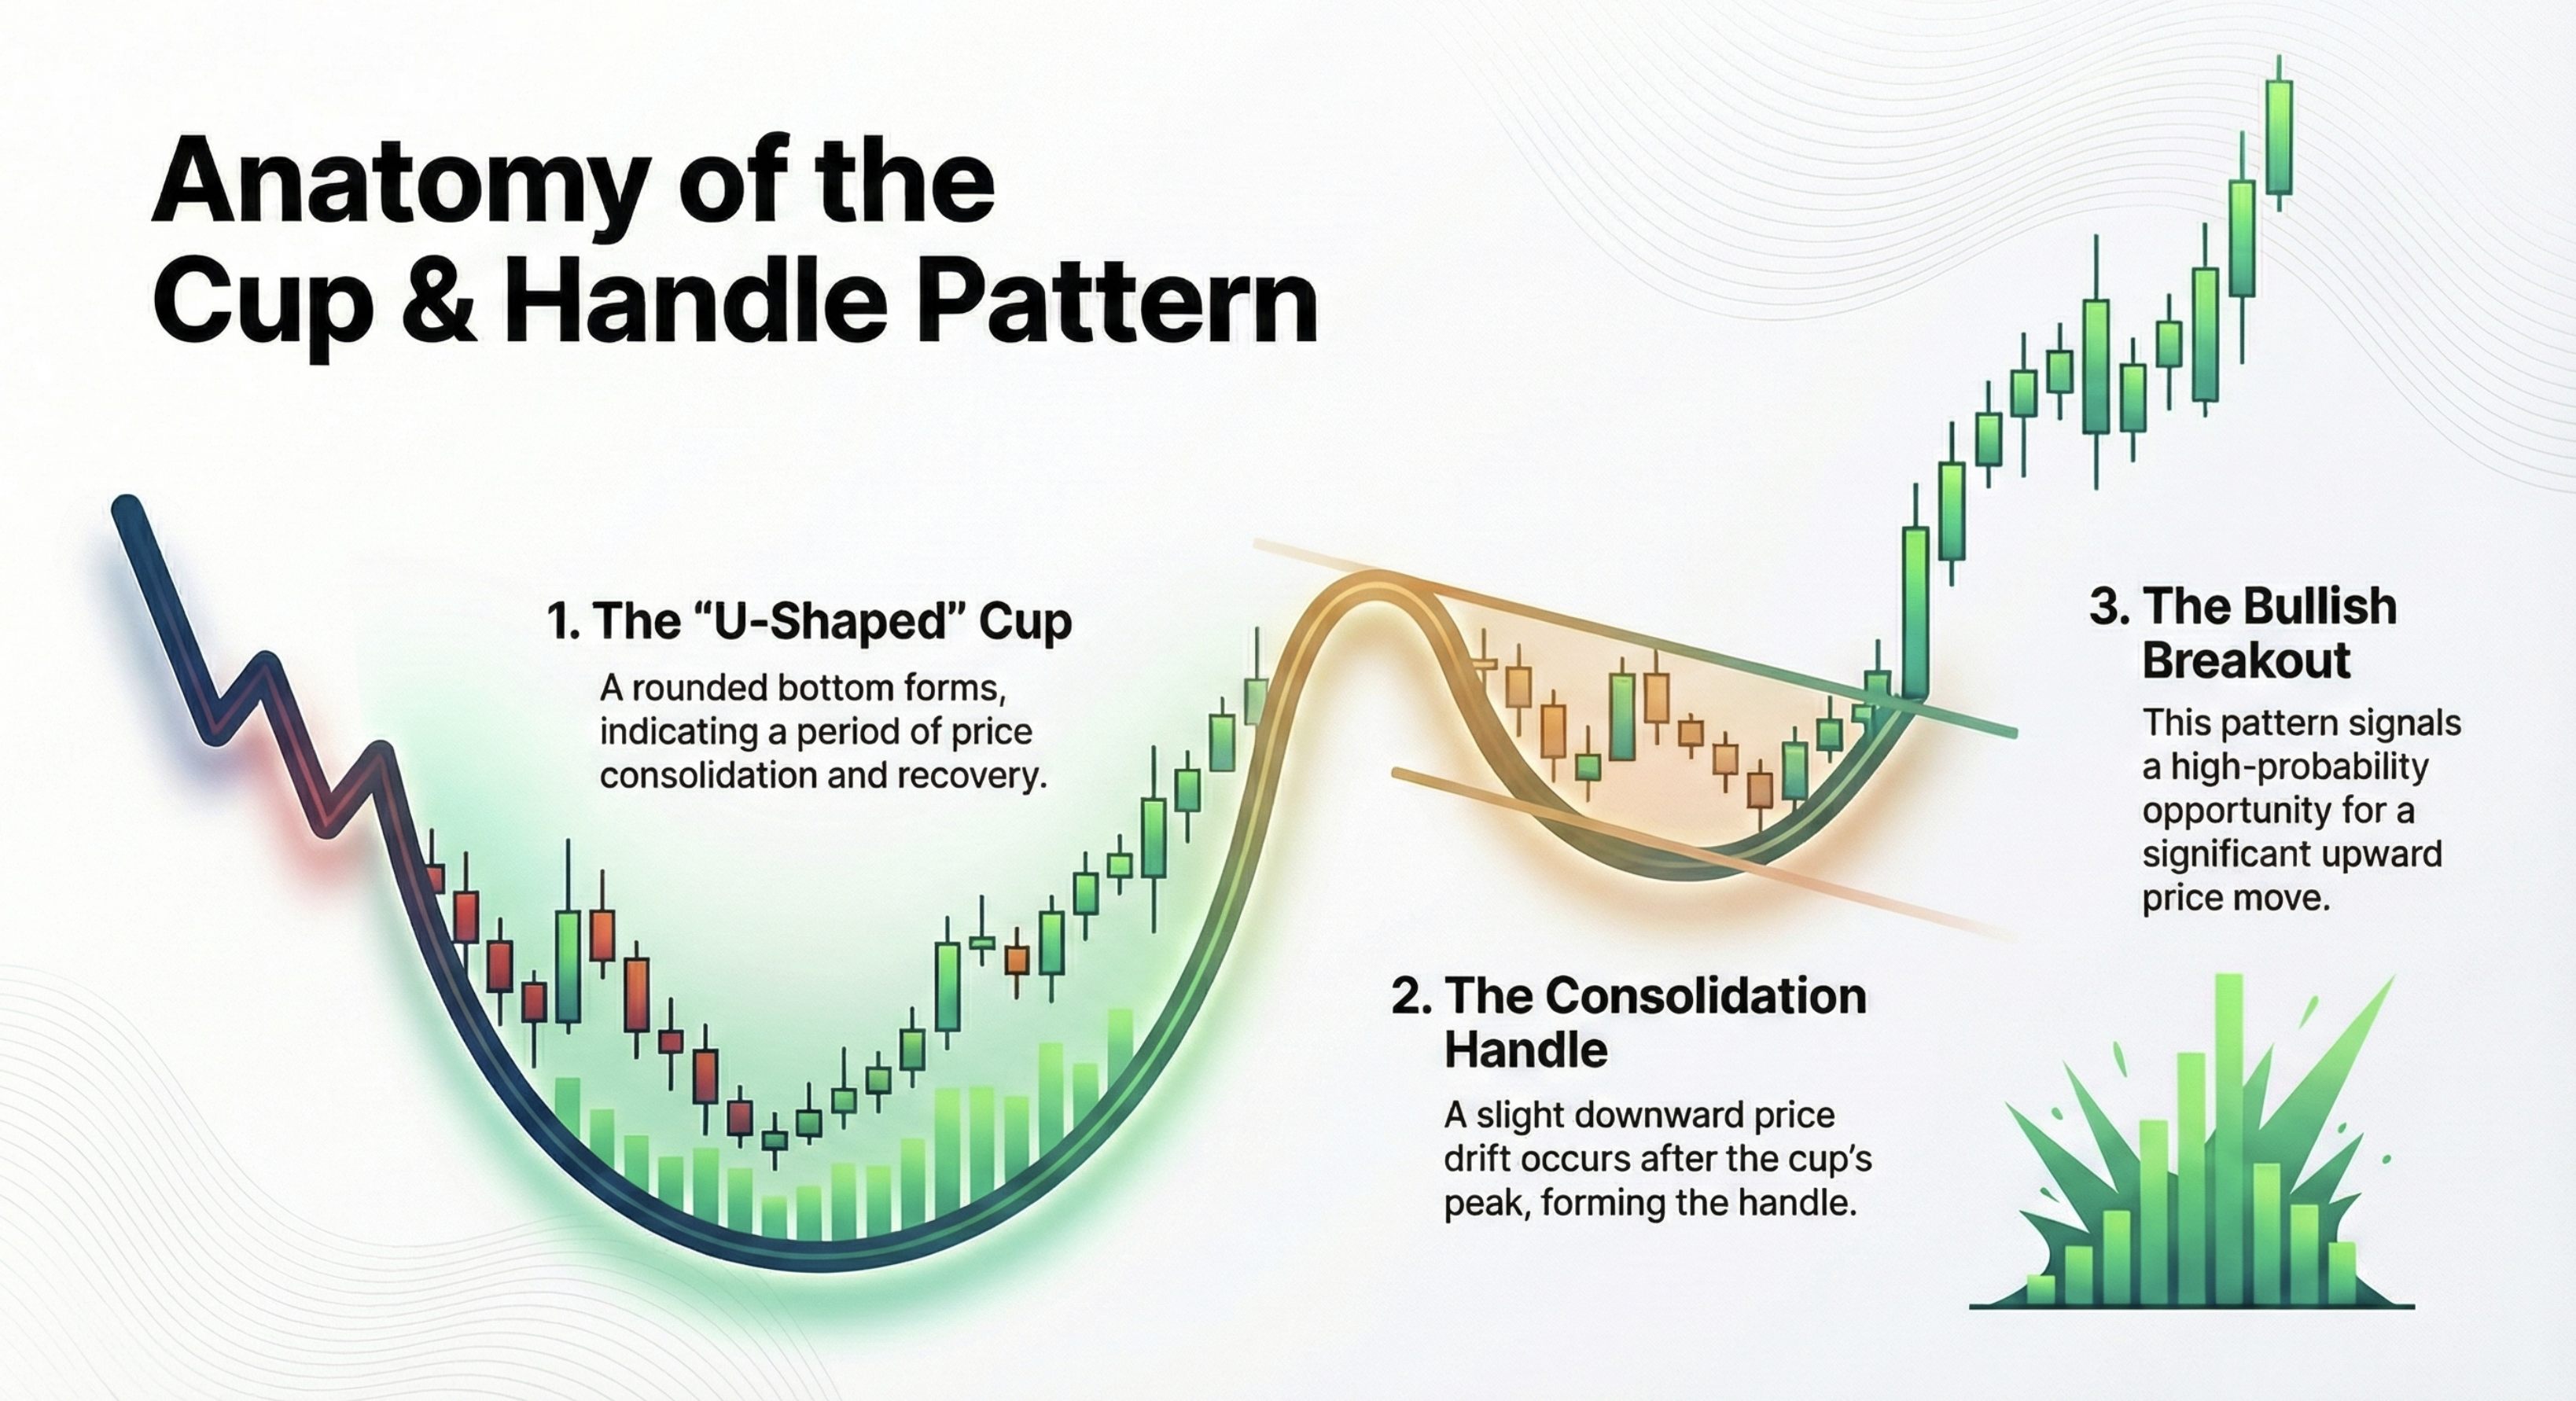
The cup and handle pattern is a bullish continuation chart pattern with a 65% success rate and 34% average gain (based on Thomas Bulkowski's research on 1,000+ patterns). It forms when price creates a U-shaped "cup" (not V-shaped) followed by a smaller consolidation called the "handle". Key requirements: cup depth of 12-33%, handle forms in upper half of cup, handle retraces less than 50% of cup depth, breakout occurs on increased volume.Entry: Buy on breakout above the handle's resistance. Stop-loss: Below the handle's low. Target: Cup depth added to breakout price. The pattern typically takes 7-65 weeks to form and is most reliable on daily or weekly charts.
Success Rate
Based on Bulkowski's research
Average Gain
After successful breakout
Early Failure Rate
Within first month
Pattern Characteristics
The Cup
- Duration: 7 to 65 weeks (typically 3-6 months)
- Shape: U-shaped bottom (rounded, not V-shaped)
- Depth: 12% to 33% correction from the high
- Volume: Decreases during formation, increases on right side
The Handle
- Duration: 1 to several weeks
- Depth: Should not exceed 12% of cup height
- Position: Forms in upper half of the cup
- Volume: Light and diminishing during formation
How to Trade the Pattern
Breakout Point
Enter when price breaks above the handle's resistance with increased volume. This is called the "pivot point."
Below Handle Low
Place stop just below the handle's low. If this level breaks, the pattern is invalidated and you exit.
Cup Depth + Breakout
Minimum target = cup depth added to breakout price. Consider trailing stop for extended gains.
Common Mistakes to Avoid
Trading V-shaped cups
True cup and handles have rounded, U-shaped bottoms. V-shapes indicate sharp reversals that are less reliable.
Ignoring volume
Volume confirmation is essential. Breakouts without volume often fail. Look for declining volume in handle, increasing on breakout.
Buying before the breakout
Don't anticipate. Wait for price to actually break above the handle resistance with confirmation.
Setting stops too tight
Give the trade room to work. Stops below handle low, not at handle low. Expect some volatility.
Frequently Asked Questions
What is a cup and handle pattern?
The cup and handle is a bullish continuation pattern that looks like a tea cup on a chart. It forms during uptrends when price makes a rounded bottom (the cup) followed by a smaller consolidation (the handle) before breaking out to new highs.
What is the success rate of cup and handle patterns?
According to Thomas Bulkowski's research on over 1,000 patterns, cup and handle breakouts have a 65% success rate with an average gain of 34%. This makes it one of the most reliable bullish patterns.
How do I identify a valid cup and handle?
Look for: 1) A U-shaped cup (not V-shaped), 2) Cup depth of 12-33%, 3) Handle forms in upper half of cup, 4) Handle retraces less than 50% of cup, 5) Breakout occurs on increased volume.
Where should I place my stop loss on a cup and handle trade?
Place your stop loss just below the handle's low. This gives you a clearly defined risk point. If price breaks below the handle, the pattern is invalidated and you exit with a small loss.
What is the price target for a cup and handle breakout?
The minimum price target equals the depth of the cup added to the breakout point. For example, if the cup depth is $10 and breakout occurs at $50, target is $60. Many traders take partial profits at this level and trail stops for additional gains.